El Niño Outlook 2026: What the +3.8°C Pacific Forecast Means
| KEYWORD_WORLD · News · Checked 24 October 2026 (KST) |
WMO forecasts a seasonal average of about +3.8°C above normal for sea-surface temperatures in the Niño 3.4 Pacific region during November 2026–January 2027. This number describes a regional ocean forecast. Use your local forecast for the air temperature where you live.
The World Meteorological Organization (WMO), the UN’s weather and climate agency, published the outlook on 21 October. Its follow-up on 22 October stresses preparing early and using regional and national forecasts to decide where and when to act.

Read the place, measure and period together
El Niño is the warm phase of a recurring Pacific ocean-and-atmosphere pattern. It can shift rainfall and temperature patterns far beyond the ocean region where it is measured.
The 21 October WMO outlook gives these details:
| Field | What this forecast says |
|---|---|
| Place | Niño 3.4, a region of the tropical Pacific |
| Measure | Sea-surface temperature, about +3.8°C above normal |
| Period | November 2026–January 2027, a three-month season |
| Type | An average across several forecast systems |
Anomaly means a difference from a reference average. Ensemble mean means the average of several forecast systems. WMO expects the warming trend to peak around December 2026.
When sharing a headline, keep those fields in the same sentence. A number copied without its place or period is easy to misunderstand. A useful note is: “Pacific ocean · three-month season · forecast.” That short record helps the next reader check what the number measures.
Use the regional risks to choose what to watch
WMO’s humanitarian weather update highlights different concerns:
| Region | Concern highlighted by WMO |
|---|---|
| Parts of East Africa | Heavy rain and flooding during the October–December rainy season |
| Southern Africa | Drier conditions from November, with possible effects on crops and water |
| Southeast Asia | Heat, rainfall shortages, wildfire and smoke hazards |
These are broad seasonal tendencies. WMO says national and regional forecasts are needed to locate the risks more precisely. The same update calls for earlier coordinated action, especially where people already face conflict or displacement.
Start with the place you need to make a decision about: home, a relative’s town, a farm or a planned journey. Write that place beside the relevant local weather service. Then check which hazard that service is actually discussing. Keep the seasonal summary and the local warning links together so a general headline does not become your only source.

Turn the outlook into a simple update routine
The following is our planning example, not a WMO timetable. Suppose a community group is arranging an outdoor event in December. Give one person responsibility for checking the official forecast and telling the group when the plan changes.
- At the planning stage: save the seasonal outlook, its issue date and the months it covers. List the local forecast and warning pages you will use later.
- As the event approaches: check the current local forecast. Review the venue’s arrangements and the organiser’s instructions against that information.
- Before people set out: check for fresh official warnings and transport or venue notices. Follow the local authority’s instructions.
- When information changes: record the new issue time and tell everyone which plan now applies.
A short shared note can contain five fields: place, decision date, source link, time last checked and person responsible. For family travel, the decision might be when to recheck a route. For an event, it might be when to contact the venue about its weather arrangements. Fill in real details rather than copying a generic checklist unchanged.
Keep like-for-like comparisons and a clear next step
Before comparing two figures, ask whether they cover the same ocean area, reference average and months, and whether each is observed or forecast. If any field differs, keep the figures separate until you can explain the difference. This article does not rank this event against an observed historical record.
For a practical next step, bookmark the current local forecast for the place that matters to you and note when you will check it again. Keep the WMO outlook as the wider seasonal context. The exact timing of a local hazard needs the more detailed information.
Which field is easiest to lose when weather headlines are shared—the place, period or meaning of the number? Leave a question below, or share this explainer with someone planning for the coming season.
Reporting and planning example: KEYWORD_WORLD. Sources checked 24 October 2026 KST. Outlook issued 21 October 2026; humanitarian update dated 22 October and marked updated 23 October. Forecast period: November 2026–January 2027. Regional examples are broad outlooks.
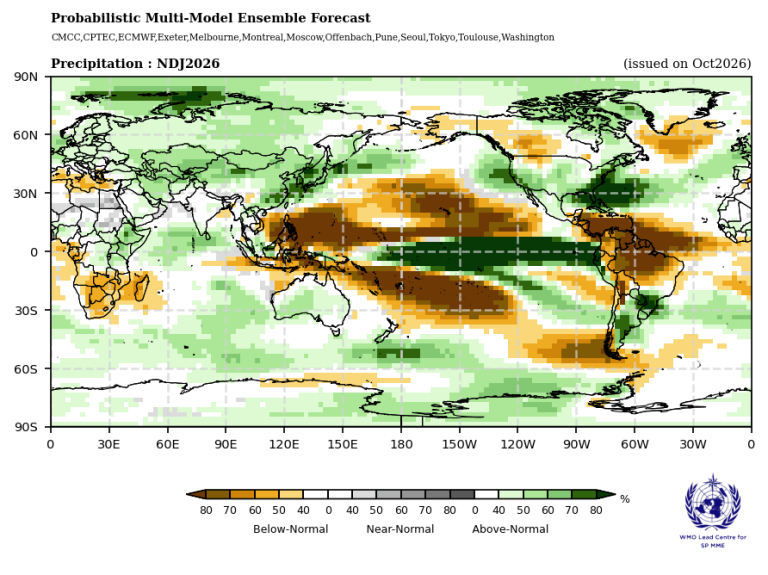
Map: WMO. Original image and legend retained; open the outlook for the full-size source.


Comments
Post a Comment