Thwaites Glacier Study 2026: What the 3 cm Sea-Level Estimate Means
| KEYWORD_WORLD · News · Checked 23 October 2026 (KST) |
A new Thwaites Glacier study puts its contribution to global average sea level at about 3 cm by 2100 in one model setup—roughly twice a comparison estimate. This is one glacier’s projected contribution under stated conditions. It is not a forecast of total sea-level rise or the water depth outside a particular home.
The useful question is what changed in the model, and what that number can tell a coastal reader. Start with the ice, then check the units, assumptions and location.

A wider zone where seawater meets the ice
NASA’s Jet Propulsion Laboratory explained the research on 20 October, following the paper’s publication on 12 October 2026. Researchers at JPL, the University of California, Irvine, and Dartmouth studied how to represent the edge where land-supported ice starts to float.
A grounding line is that boundary. A grounding zone is a wider transition area: seawater can reach beneath ice that is still partly supported by the seabed. Tides can lift the ice and move water through this area. Relatively warm water can melt its underside.
The revised model includes that wider, actively melting zone. JPL says this improves its match with past satellite observations. The change matters because the model must explain what the glacier has already done before researchers use it to explore its future.
Read 3 cm with its year and assumptions
The open-access Nature Communications paper reports 30.1 ± 5.7 mm by 2100 for a setup with a grounding-zone length of 5 ± 1 km. Its comparison multi-model mean is 15.2 mm under the same constant-climate conditions. The rounded headline is about twice as much.
| Number | How to read it |
|---|---|
| 30.1 mm | 3.01 cm, rounded to about 3 cm |
| 30.1 ÷ 15.2 | About 1.98 times the comparison mean |
| By 2100 | A cumulative contribution by that year, not a yearly rate |
Those conversions are our arithmetic. The ± value is the paper’s reported uncertainty. The experiment keeps climate conditions constant, uses a fixed grounding-zone length and simplifies ocean processes. These choices isolate one mechanism; future outcomes remain uncertain.

A global average cannot set a street’s flood depth
NOAA distinguishes global sea level from local, relative sea level: the water’s height compared with nearby land. Land can sink or rise, and regional ocean currents and other local conditions also affect the result.
Rising seas have more than one cause. Warming seawater expands, while melting land-based glaciers and ice sheets add water. A result for Thwaites belongs within that wider picture.
Tide stations track water levels against a local land reference. Satellites help measure the ocean more broadly. For a coastal decision, look for a location-specific source and its reference level. A world average alone cannot tell you whether a particular road, building entrance or drainage system will flood.
Use a coastal map as a planning tool
For covered US coastal areas, the NOAA Sea Level Rise Viewer offers local scenarios and mapping-confidence information. Use a desktop or a tablet in landscape mode. A scenario is a possible future used to ask “what if”.
- Find the place. Search the address or city, and confirm that the area is mapped.
- Keep the year and scenario together. Compare the local options; do not paste the glacier’s 3 cm into a map and call it a local forecast.
- Read Mapping Confidence. Check the uncertainty in the underlying elevation and water-level mapping.
- Read the limitations. NOAA’s maps show potential flooding at a broad scale. They exclude factors including erosion, land sinking and future construction, and are planning references rather than a basis for legal or permitting decisions.
For another country, use the responsible coastal or flood authority’s local guidance. Our reading checklist is simple: which place, which year, which scenario and which uncertainty? Keep those four details when you share a sea-level headline.
Which part of a climate headline do you most often need explained—the units, the model or the local impact? Leave a question below, or share this guide with someone comparing coastal forecasts.
Reporting and calculations: KEYWORD_WORLD. Sources checked 23 October 2026 KST. Paper: 12 October; JPL briefing: 20 October; NOAA background page last updated 23 September 2026. Future model results are projections.
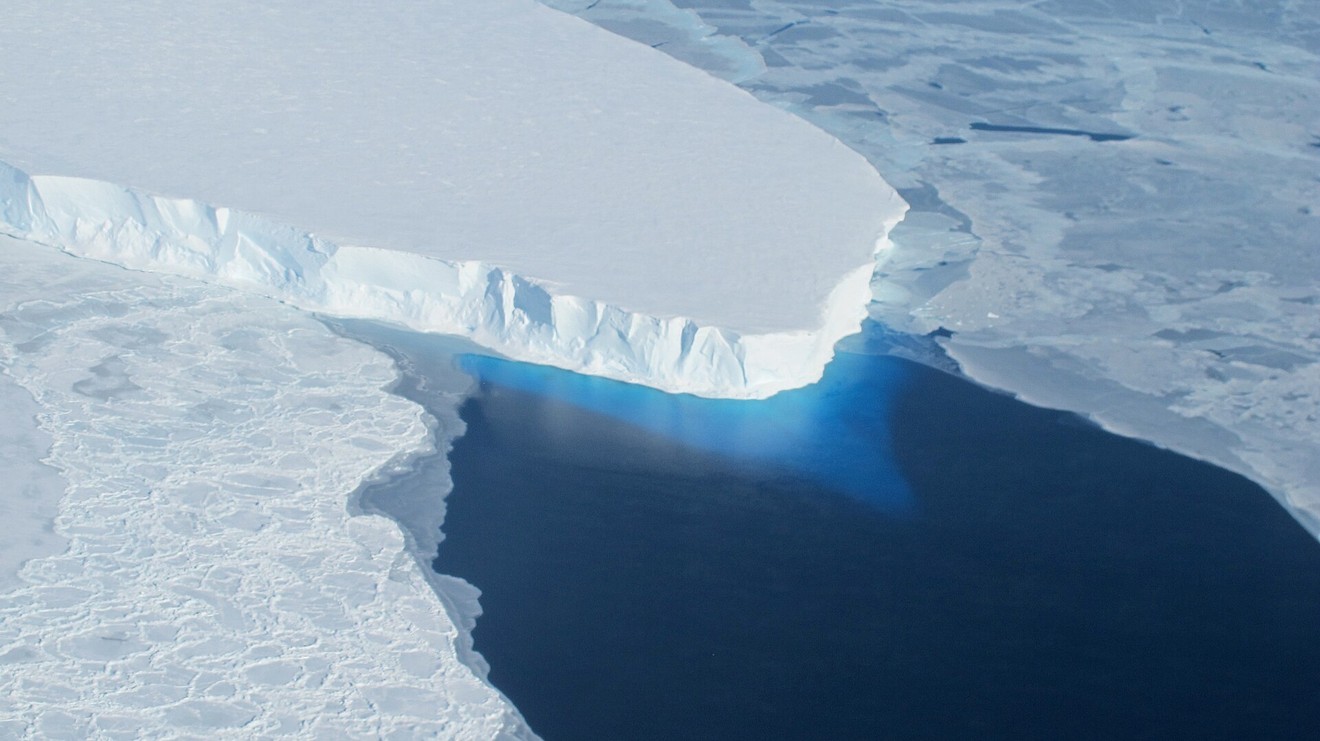
Linked photograph: NASA/OIB/Jeremy Harbeck, 2014. The card opens JPL’s original public briefing.


Comments
Post a Comment