WMO’s 2025 CO2 Record: What 426.8 ppm Means
| KEYWORD_WORLD · News · Checked 28 October 2026 (KST) |
426.8 ppm describes the average concentration of carbon dioxide in the atmosphere in 2025. It tells us how much CO2 was present relative to air. The new WMO report also records a further annual increase, even though that increase was smaller than the previous year’s exceptional rise.
The World Meteorological Organization published Greenhouse Gas Bulletin No. 22 on 27 October 2026. Its main annual observations cover 2025. Keep those two dates together when reading a headline: the publication year and the year being measured serve different purposes.

Start with the gas, year and unit
The Bulletin’s summary gives the following globally averaged surface concentrations. The plus/minus figures are the uncertainties published by WMO. Retain them when copying the measurements.
| Gas | 2025 level | Unit |
|---|---|---|
| Carbon dioxide (CO2) | 426.8 ± 0.2 | Parts per million (ppm) |
| Methane (CH4) | 1,948 ± 2 | Parts per billion (ppb) |
| Nitrous oxide (N2O) | 339.1 ± 0.1 | Parts per billion (ppb) |
Read across a whole row. Methane’s larger printed number uses a different unit from CO2. There are 1,000 parts per billion in one part per million. A shared unit is needed before comparing amounts; the table itself does not rank the gases’ warming effects.
These are global annual averages. A number from one monitoring station, one month or a room sensor answers a different measurement question. Check the stated place and period before putting two figures side by side.
A smaller addition can still lift the total
WMO’s 27 October press release says the global average CO2 concentration rose by 2.8 ppm from 2024 to 2025. The Bulletin says this was below the exceptional increase from 2023 to 2024, while remaining slightly above the 2016–2025 average annual growth rate.
Concentration is the level. Annual growth is the change in that level. A positive change keeps adding to the total even when the change becomes smaller.
Illustrative arithmetic, not measured CO2 data: begin with 100 units. Add four units and the total becomes 104. Add three in the next period and it becomes 107. The second addition is smaller, while the total is higher. The example assumes successive periods and the same unit throughout.
That is why a story about slower growth needs both the level and the increment. When reading a chart, identify which panel shows concentration and which shows annual change before drawing a conclusion.

Read ppm and the historical baseline separately
Parts per million can be converted into a percentage of the mixture. Using the reported central CO2 value, the arithmetic is 426.8 ÷ 1,000,000 × 100 = 0.04268%. This is a unit conversion of concentration; it does not calculate a share of warming.
WMO also expresses the 2025 CO2 level as 153% of the 1750 baseline. This is a different comparison. The Bulletin describes it as 53% above the pre-industrial level.
Think of the baseline as an index of 100. A level of 153 is 53 higher than 100: 153 − 100 = 53%. Keep “of the baseline” and “above the baseline” attached to their numbers. Avoid deriving an exact historical concentration from a rounded percentage.
Check what the headline is measuring
WMO distinguishes atmospheric concentrations—the amount accumulating in the air—from new annual emissions. Its release explains that roughly half of the CO2 emitted each year remains in the atmosphere, while land ecosystems and oceans absorb the rest. Absorption is part of the balance behind the measured level.
The agency’s greenhouse-gas background page explains that these gases trap infrared radiation emitted by Earth. Human activity adds to the natural greenhouse effect as concentrations increase. A small percentage of air is therefore not a measure of how little a gas matters.
For a useful reading note, record four things: the publication date, the observation period, the unit, and whether the number is a concentration, an annual change or an emissions figure. Add the geographic scope if you plan to compare it with another source.
For this release, that note begins “published October 2026; observations for 2025; global surface concentrations”. A full-year 2026 concentration would need its own completed observation period and assessment. Keep any expectation about later levels separate from the measured 2025 result.
Which part of climate reporting is hardest to read: ppm, the annual change or the historical baseline? Leave your question below, or share this checking method with someone following the new report.
Reporting and calculations: KEYWORD_WORLD. Published source: 27 October 2026. Checked: 28 October 2026 KST. Statistical period: 2025 annual averages; growth comparison: 2024–2025; historical baseline: 1750. Teaching arithmetic and reading suggestions are our own.
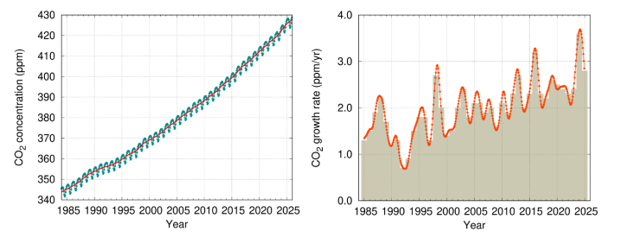
Source preview: WMO’s CO2 concentration and annual-change figure, 1984–2025. Original chart proportions retained. Open the official release for the larger figure.


Comments
Post a Comment